Beyond Data Visualisation
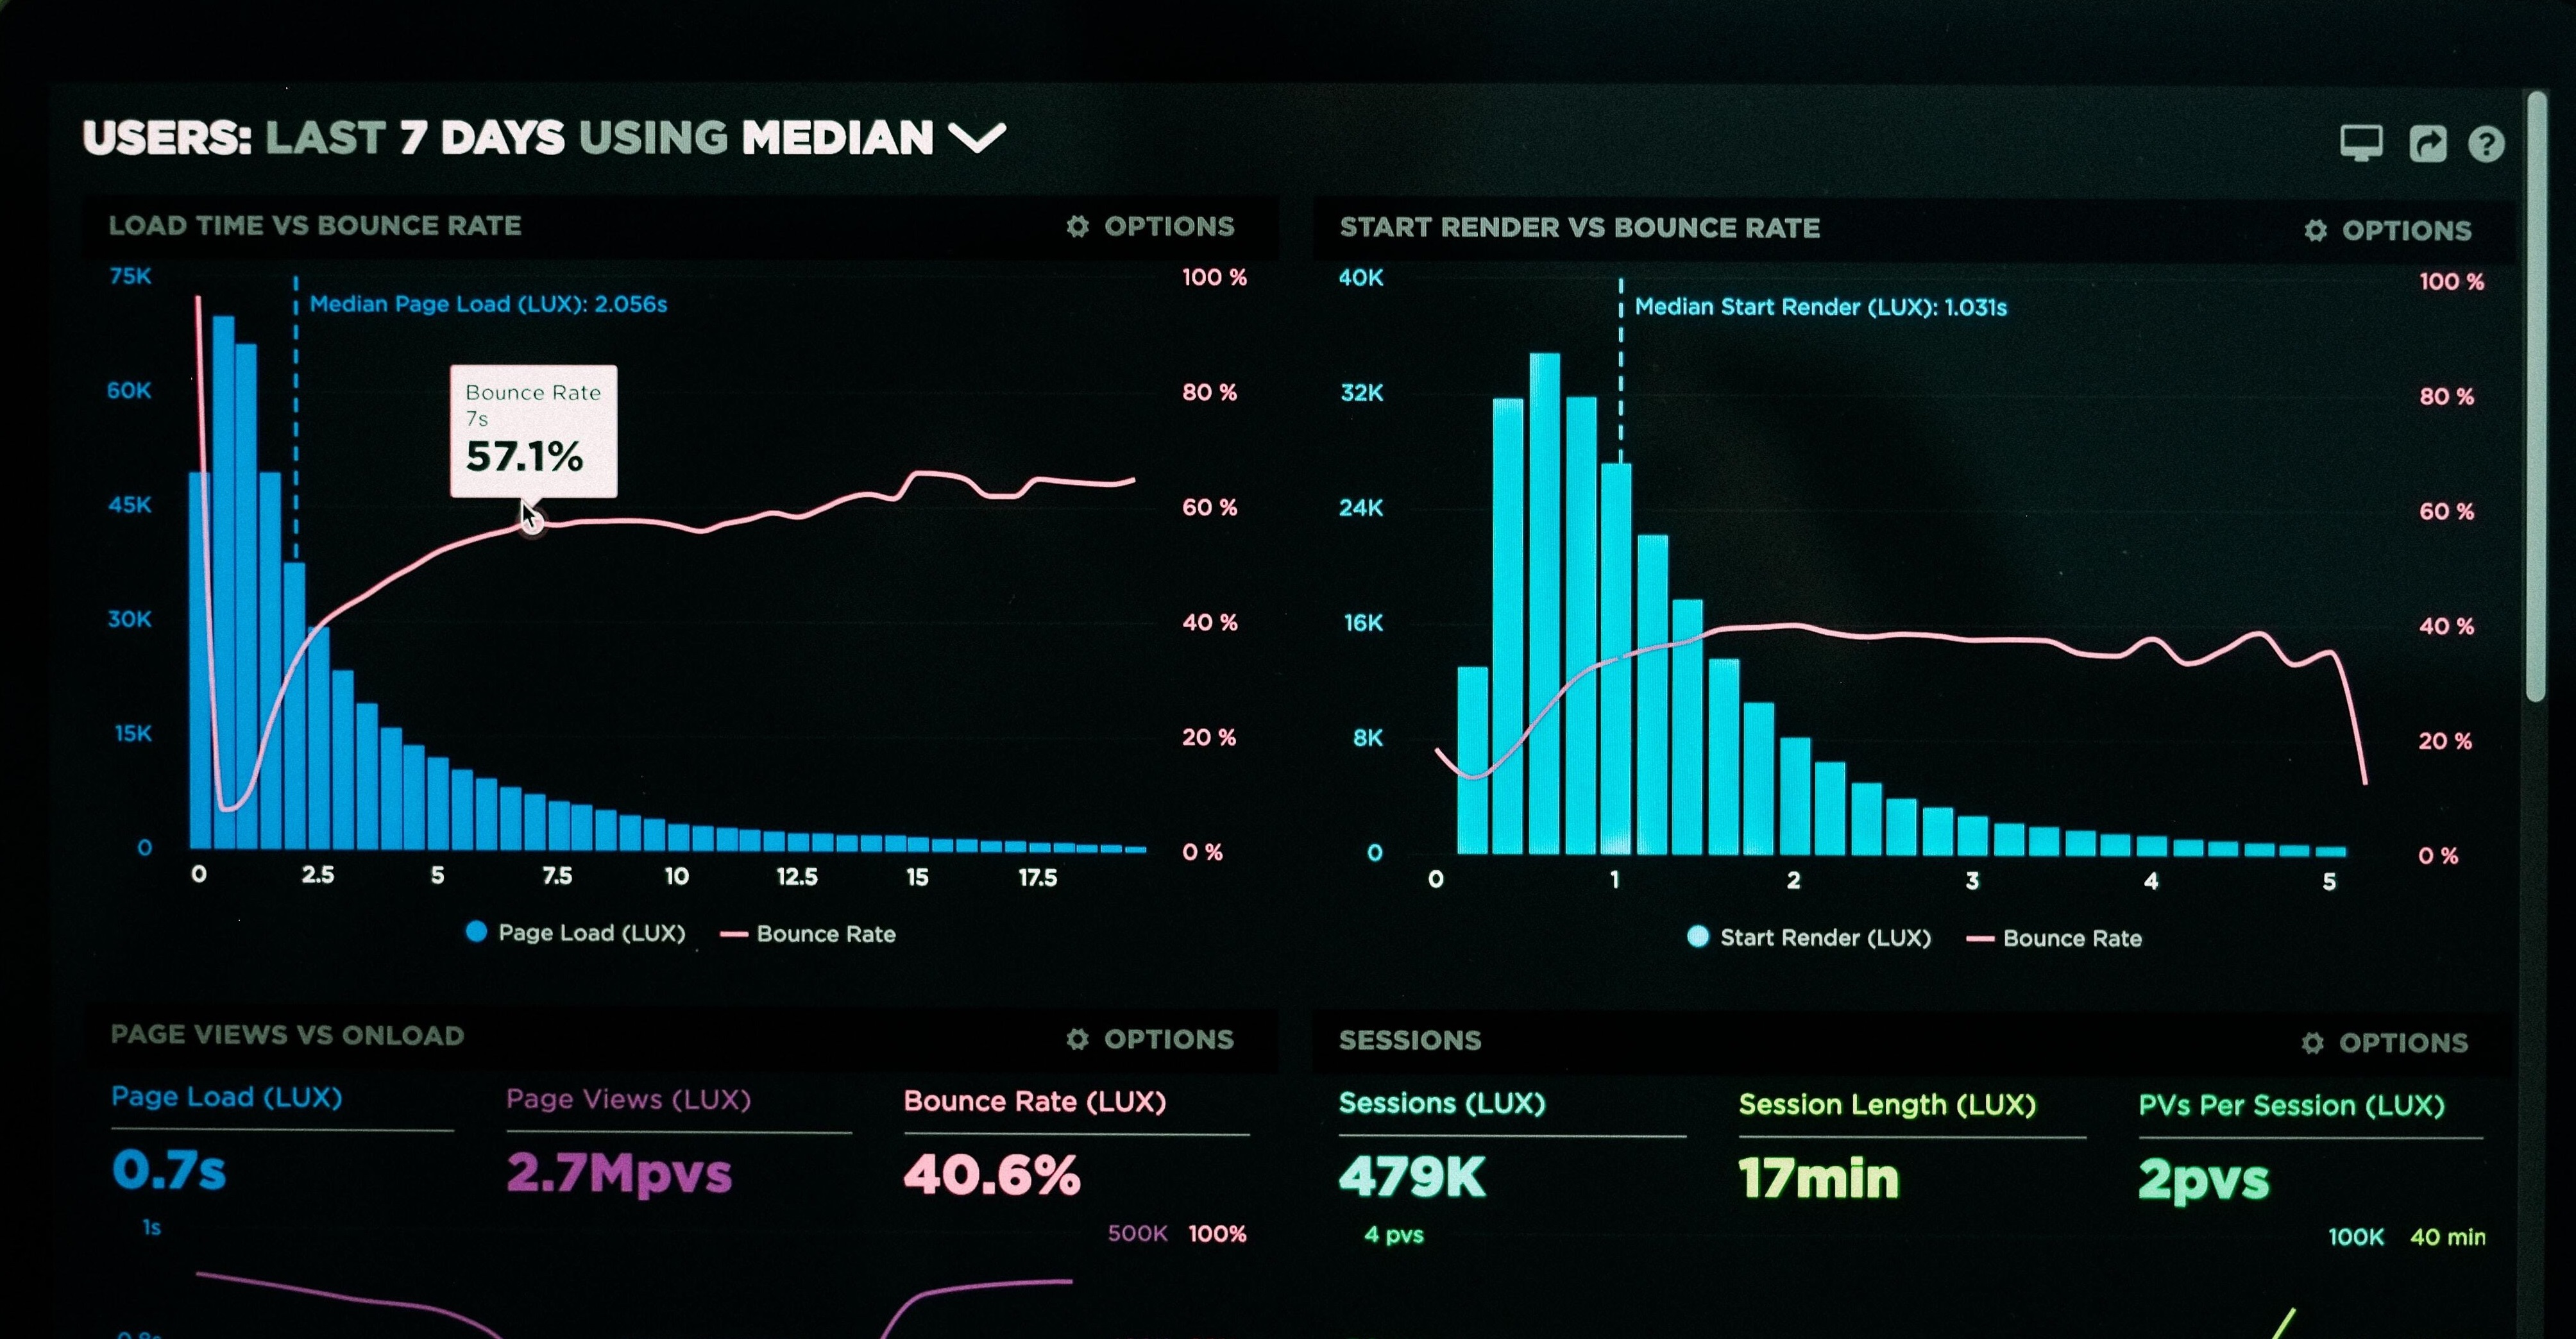
The two terms, data analysis & data visualization seem to have become synonymous, but they are not. A good data expert strives to reach to the analysis through the visualizations. Simple plotting of beautiful graphs covers just the number crunching part, what elevates those visuals is the information and inferences one draws out utilizing statistics and analysis. A large number of people are focusing just on data visualization skills while not necessarily specifying the importance of analytical skills.
Data Analysis involves attaching meaning to the data and drawing insights out of it. Data visualization is the process of putting data into a chart, graph, or other visual formats that helps inform analysis and interpretation and not just pretty visuals to look at. Data visuals present the analyzed data in ways that are accessible to and engage different stakeholders done using systematic methods to look for trends, groupings, or other relationships between different types of data.
The greatest value of a picture is when it forces us to notice what we never expected to see.
John W. Turkey
Here we take the example of live accident data to showcase how visualizations integrated with structured inspections to bring out new information and understanding of the scenario at hand. We will dive deep to grasp why certain results have come about and identify opportunities for improvements with further investigation of the data, exploring it as an analyst, beyond producing dashboards.
Our aim here is to understand the causes of accidents, find any patterns persisting in sever accidents, and identify areas of improvement to reduce or prevent such cases. Now we know that more than 38000 people die every year in crashes on U.S. roadways, with a fatality rate of 12.4 deaths per 100 thousand. It is evident that with the increasing number of vehicles in urban and suburban roads, the cases of vehicle accidents are also increasing. We narrowed down our options to the United States' Emerald City, Seattle. It is a seaport city on the west coast of the US and is the largest city in both the state of Washington and the Pacific Northwest with a living population of ~4 million. We gathered our data from the Seattle Department of Transportation (SDOT). The open-sourced data is regularly updating since 2004. Without further ado, let us jump to analysis.

Image courtesy: Timonthy Eberly
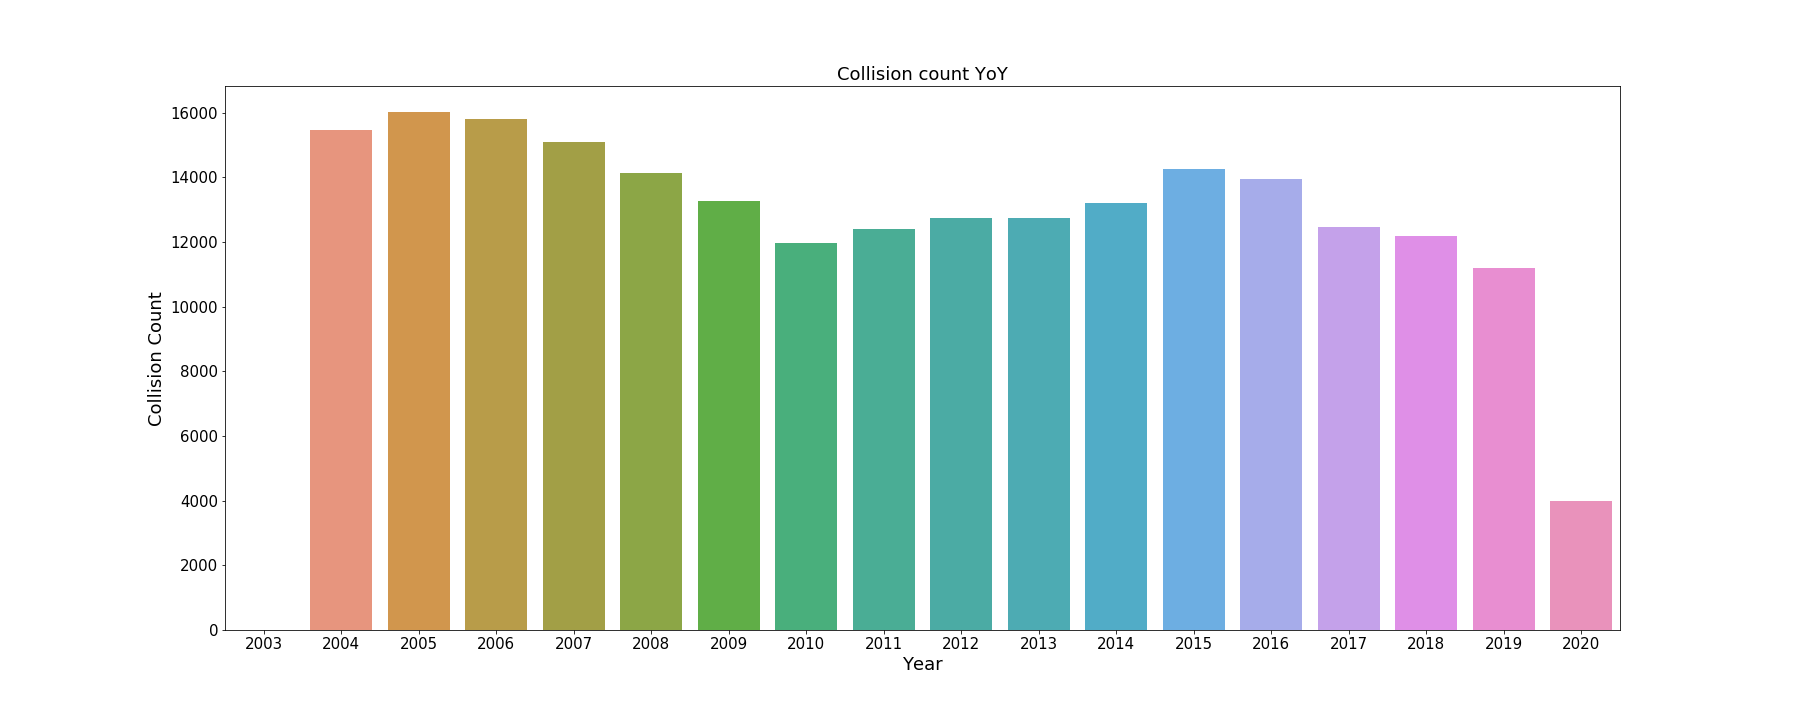
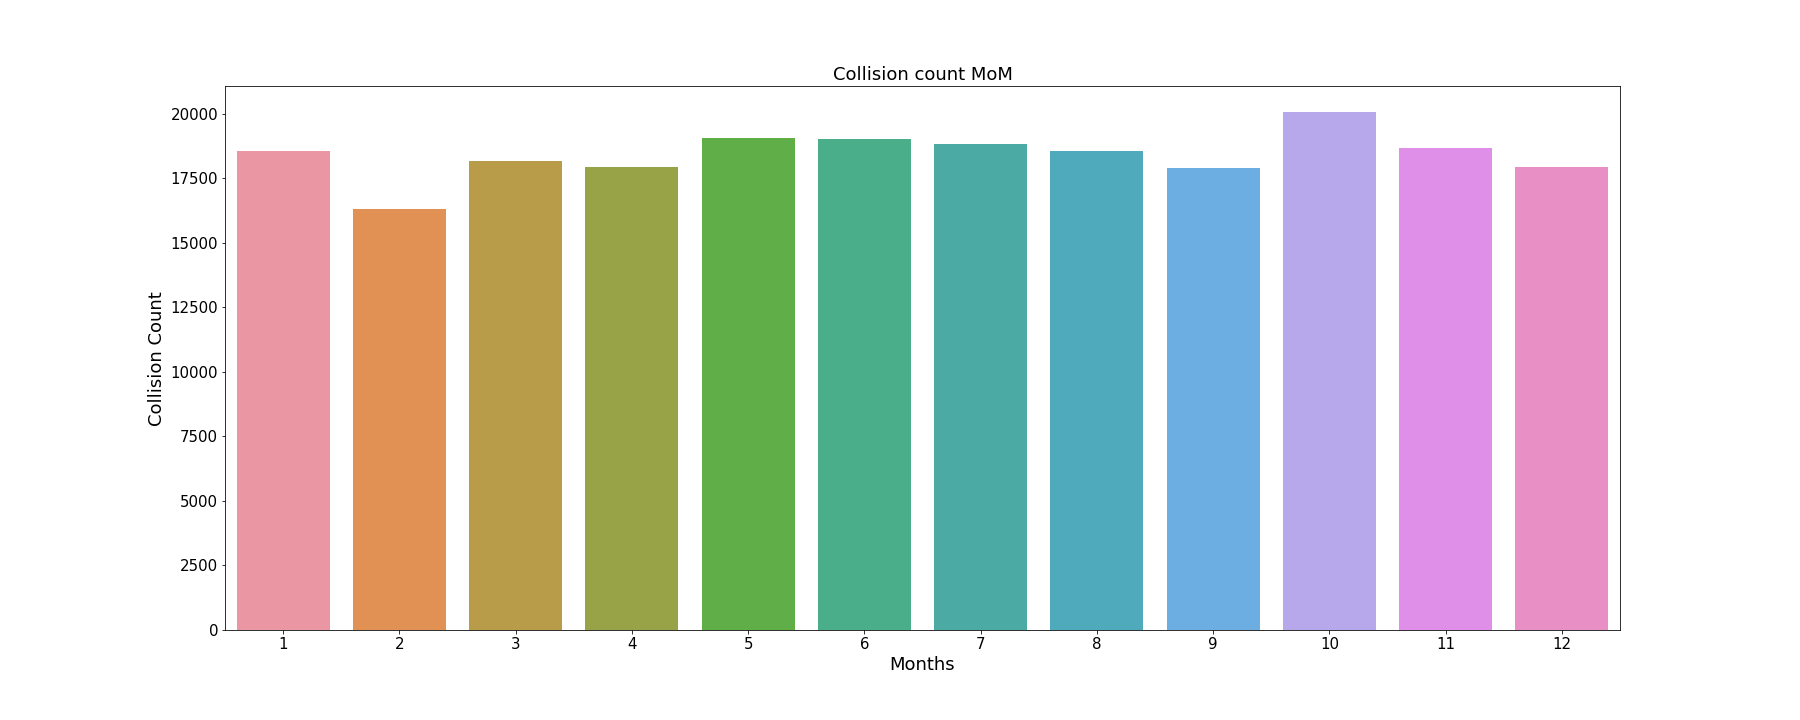
Accidents declining YoY? Not so sure
Although there is no clear trend visible, it seems that cases are declining yearly. There is no pattern of accidents with the months.
How does time play on collision?
To analyze the data based on timestamp, it was helpful to divide the data into 6 equal time buckets.
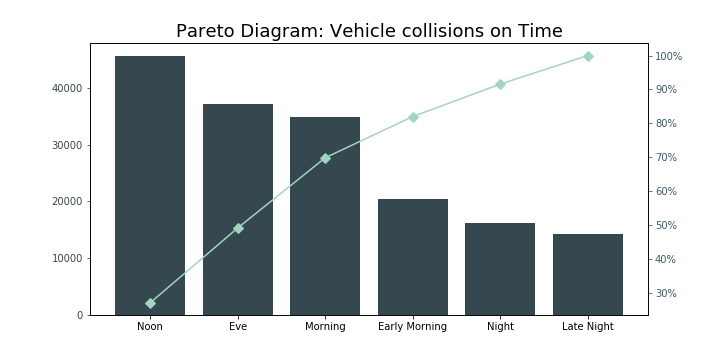
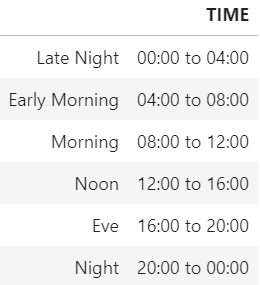
We can see that almost 50% of cases happen between 12:00 P.M. and 08:00 P.M.
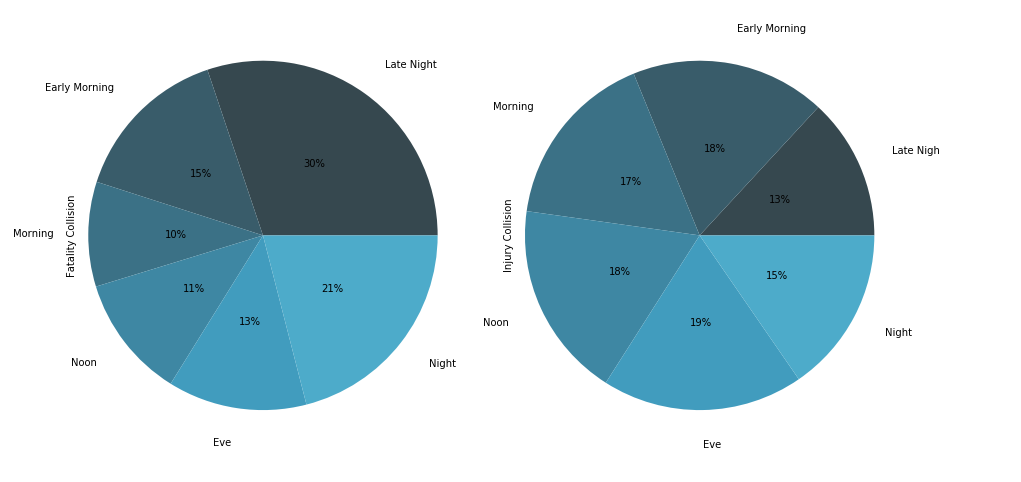
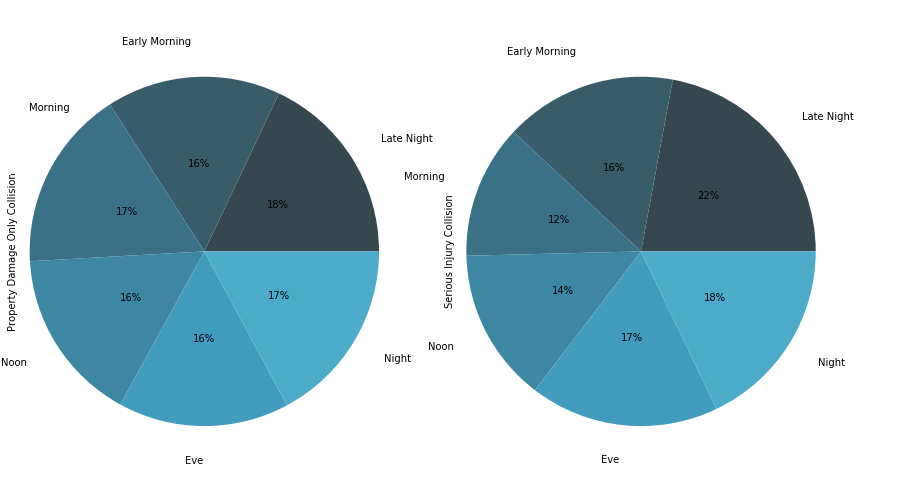
But what is the look on collision severity? Although there is no clear correlation between the severity of accidents and time of the day, during late-night, severe accidents are rare. 3 of 4 accidents happening during late-night are just doing property damage.
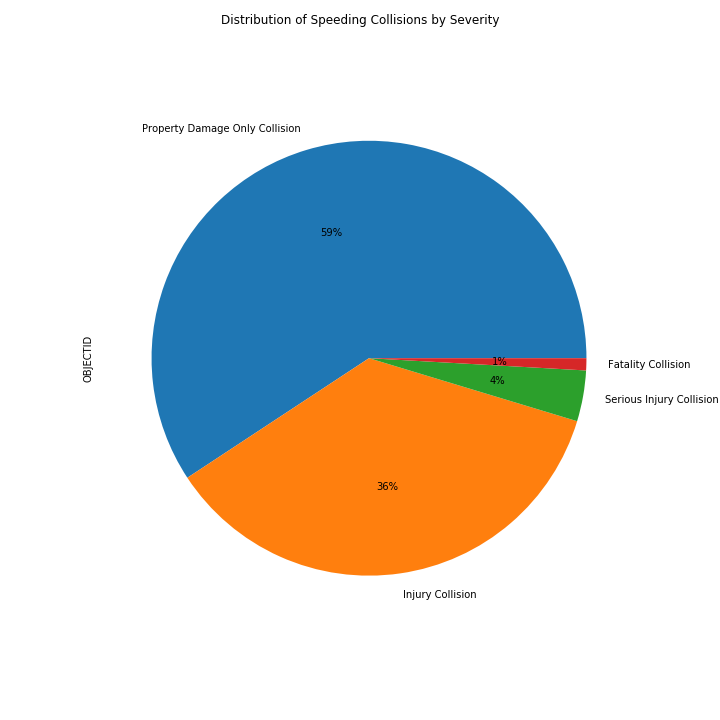
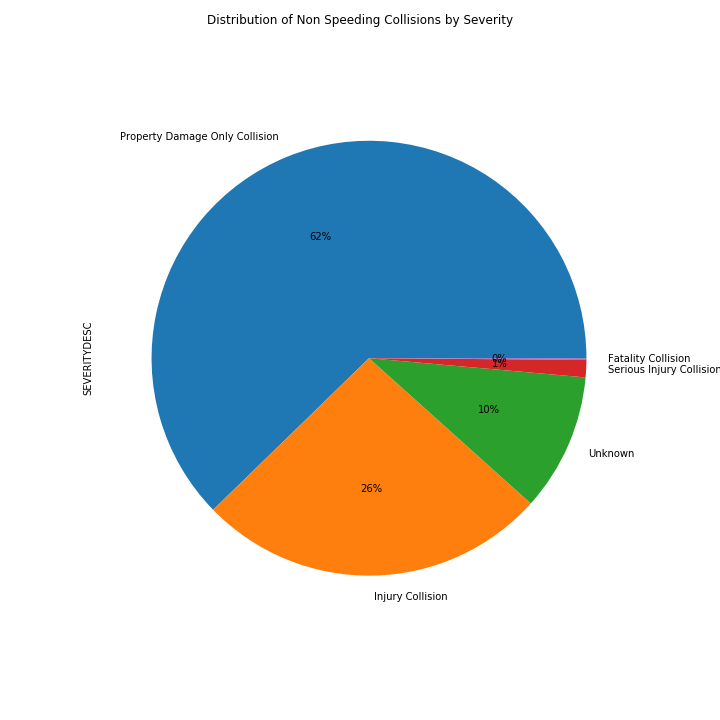
Speed thrills, but it kills
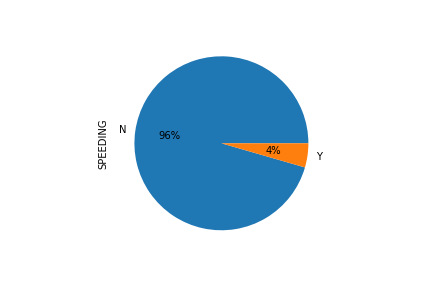
Although just 4% of all the collision cases are because of speeding it is worth noting that the percentage of Injury collisions increases from 26.52% out of the non-speeding collisions to 36.3% in the case of speeding collisions. Similarly, Serious injury collisions increase from 1.39% to 3.92% Likewise, Fatal injury collisions increase from 0.15% to 0.89% because of speeding. While the percentage of Property Damage Only Collisions decreases from 62.14% to 58.87%It shows that indeed, speeding kills more.
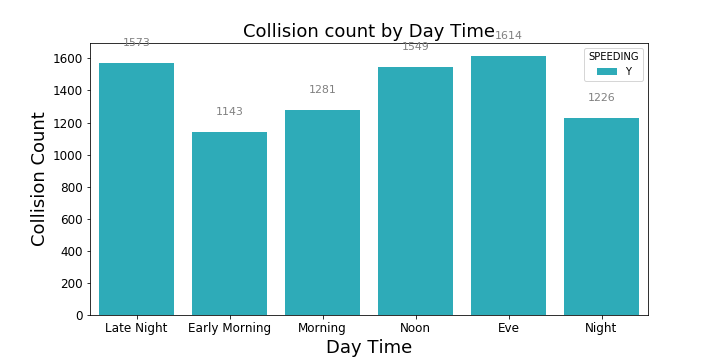
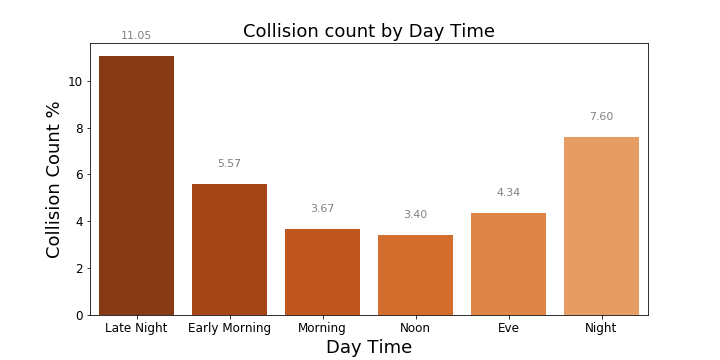
Speeding cases distributed with time shows that there are a similar number of cases in Evening, Late Night, and Noon. But percentage-wise distribution tells some different story. 11.05% of all accidents happening in late-night are because of speeding, indicating speeding accidents are more likely to occur at night due to less visibility.
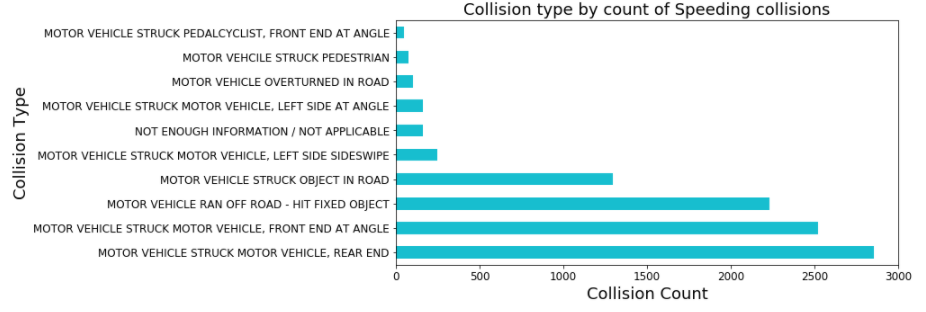
While analyzing collision type, we noticed that majority of speeding collisions are due to motor vehicles striking another motor vehicle from the rear end (which was expected).
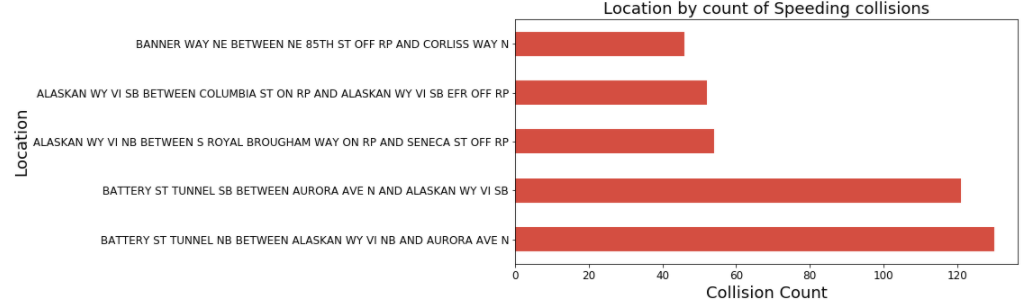
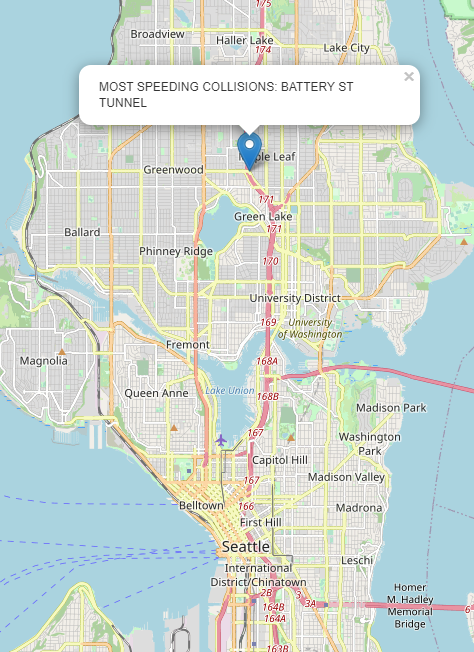
In the search of speeding collision hotspots, we found "Battery Street Tunnel" to be on the top of the list.

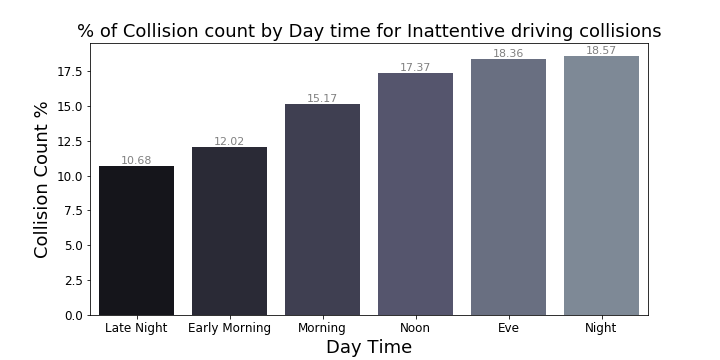
Is calling while driving the right call?
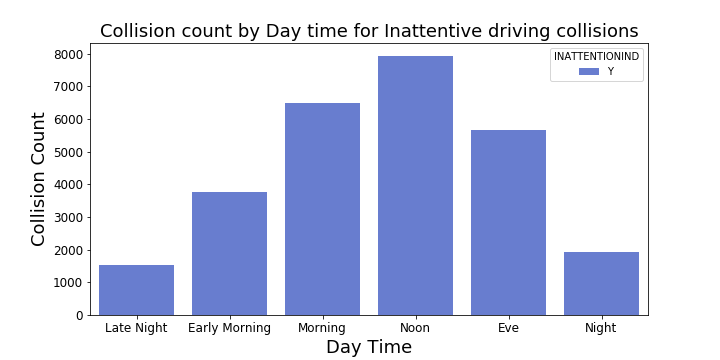
Distraction and inattention pose a considerable threat to road safety, not only for car drivers but also for vulnerable road users. Our data shows that ~18% of collisions happening in the morning and early morning are due to inattention of drivers.
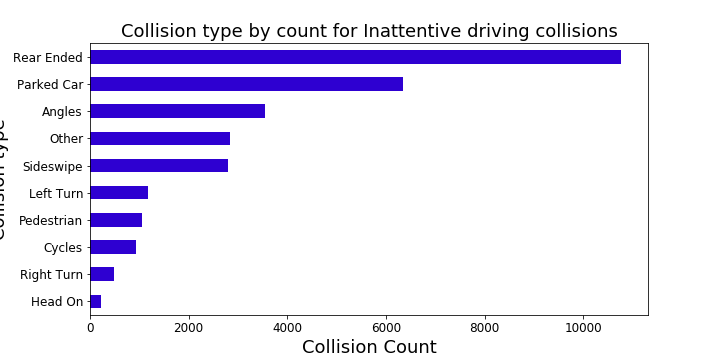
We noticed that 35% of collisions happening because of inattention are rear-ended collisions.
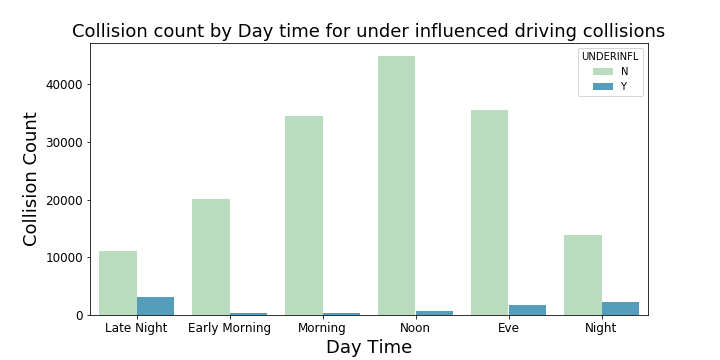
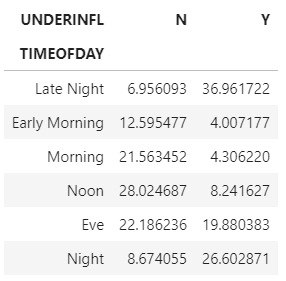
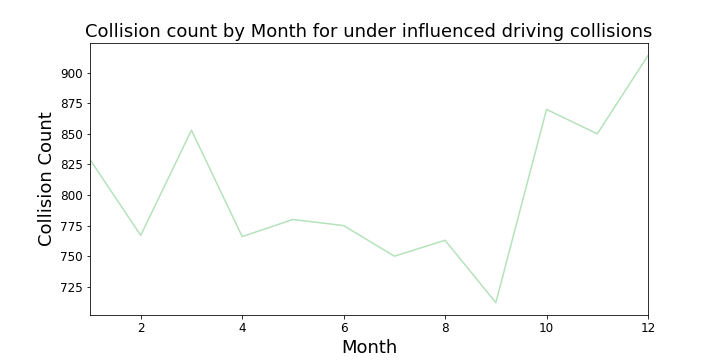
Analysis of drink and drive
Alcohol/drug-influenced accidents are becoming a huge problem for metropolitans. It is quite evident from the data of total alcoholic and drug-induced collisions, ~64% of cases happen during Night and Late Night.
We can see there are relatively more cases of alcoholic and drug-influenced collision during December (Probably because of the holiday season)
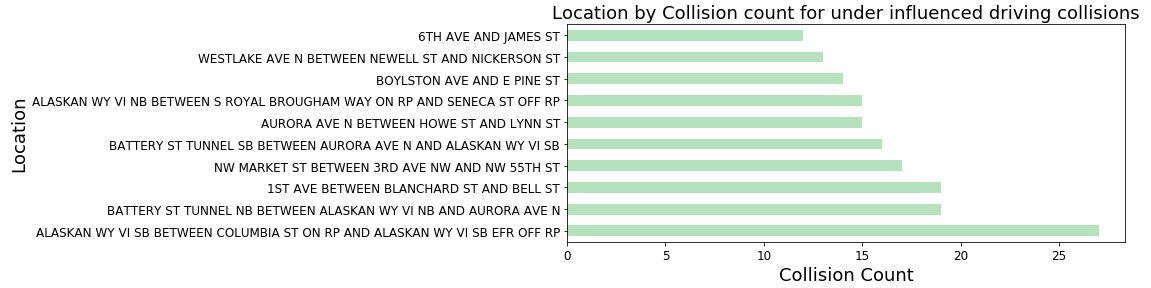
ALASKAN VI SB BETWEEN COLUMBIA ST ON RP AND ALASKAN WY VI SB EFR OFF RP has the greatest number of cases of under influence collisions
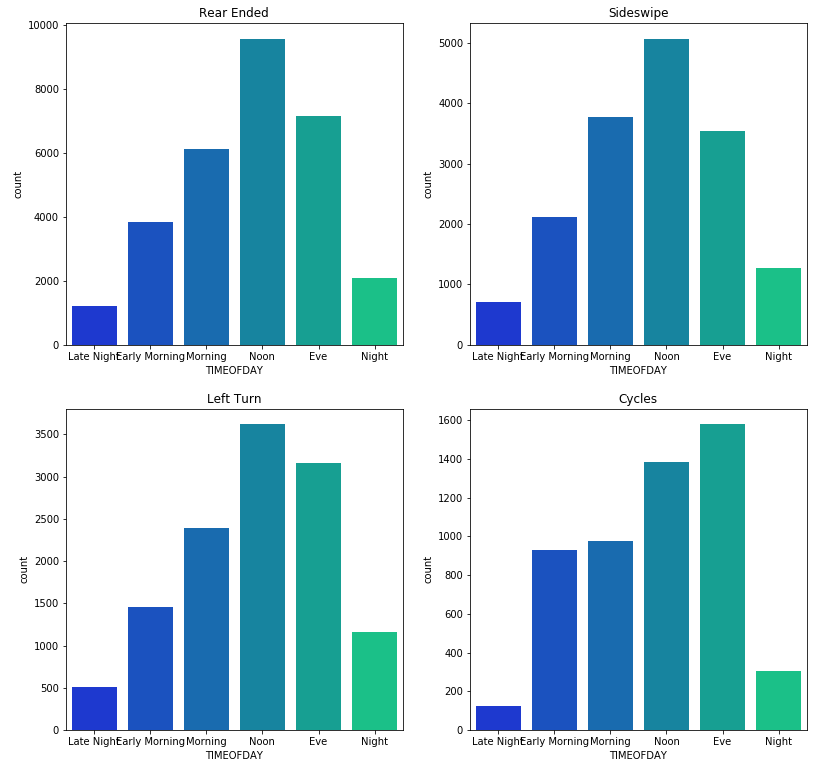
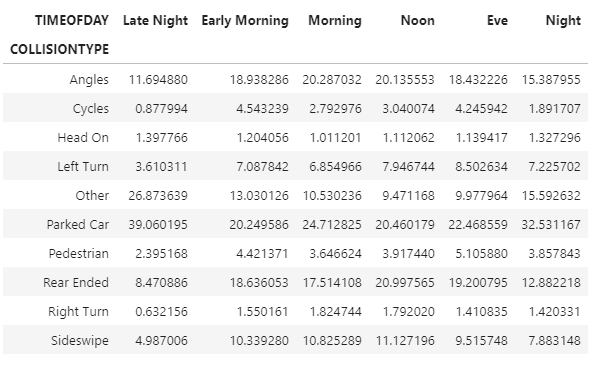
How you hit matters
We analyzed the distribution of collisions by the collision type. Collision type is further bifurcated by the SDOT collision code. It is a unique code that describes how the collision occurred.
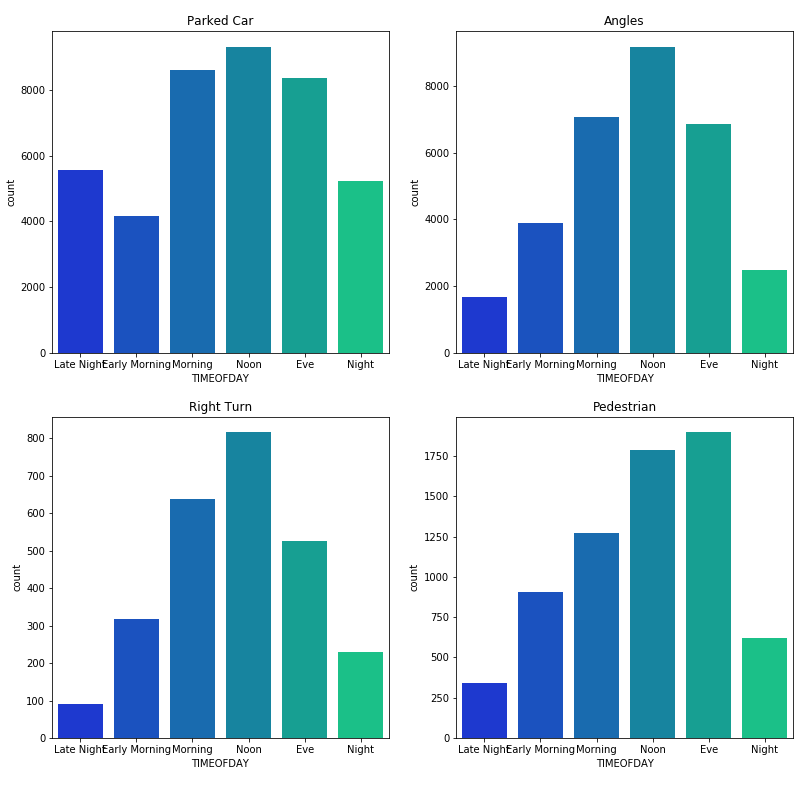
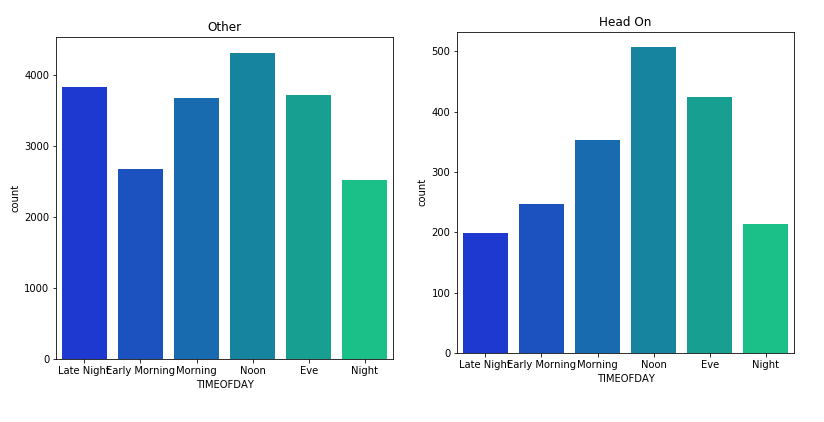
People are more likely to hit Parked cars during Night. Motor vehicles tend to hit fixed objects more during late night-time, again a cause of low visibility.
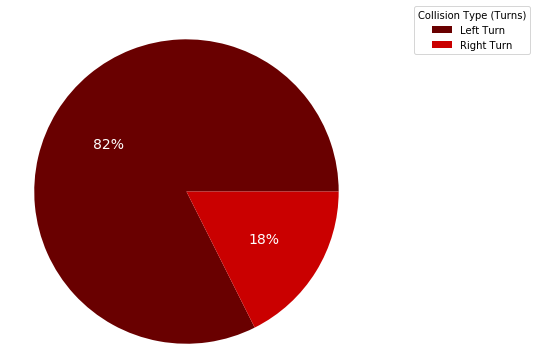
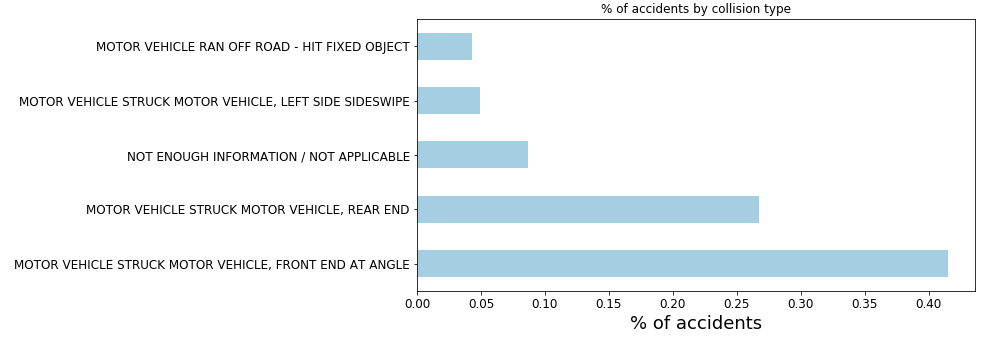
Turning Left ain’t right!!
During this analysis, we came across a striking insight. There is ~65% more chance to encounter a collision while taking a Left turn than taking a Right turn. This stat indicates that people are more complacent while taking a left turn than taking a right turn. This might be because in a right turn mostly they cross a lane at the intersection to reach the other side, thus requiring more attention.
We can see ~40% of collisions are of a motor vehicle striking another motor vehicle's front end at an angle.
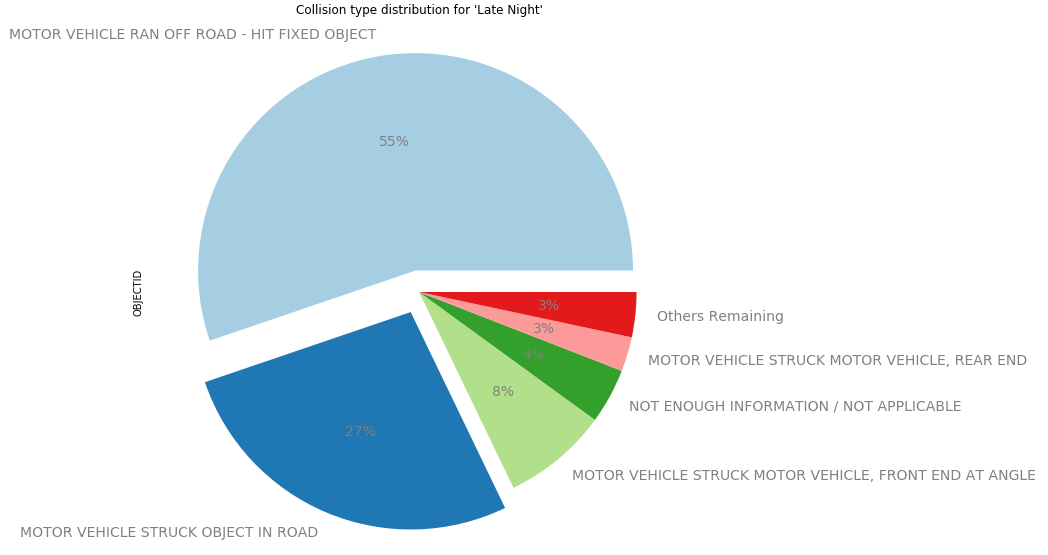
During late night, people tend to have more collisions with fixed objects on road, once againvisibility reigns supreme.
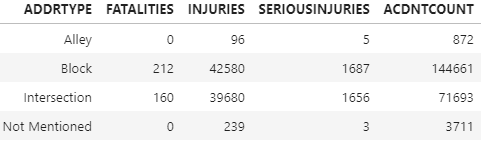
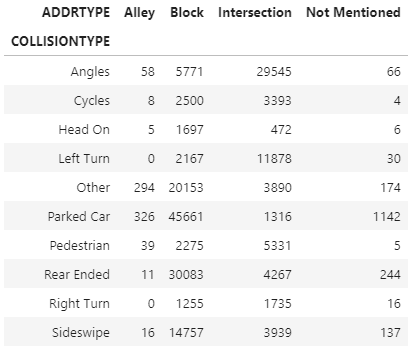
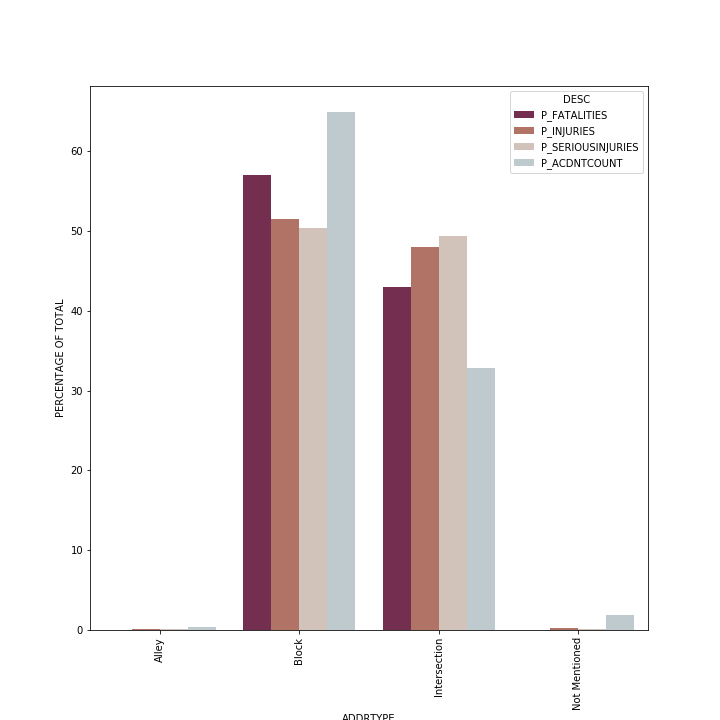
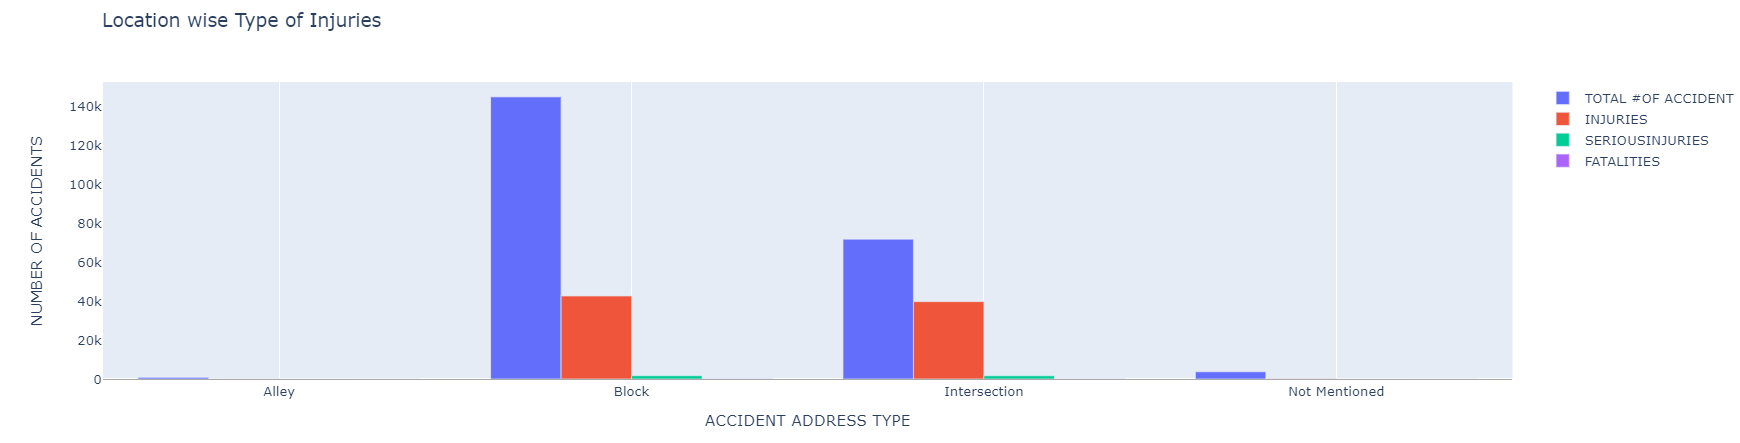
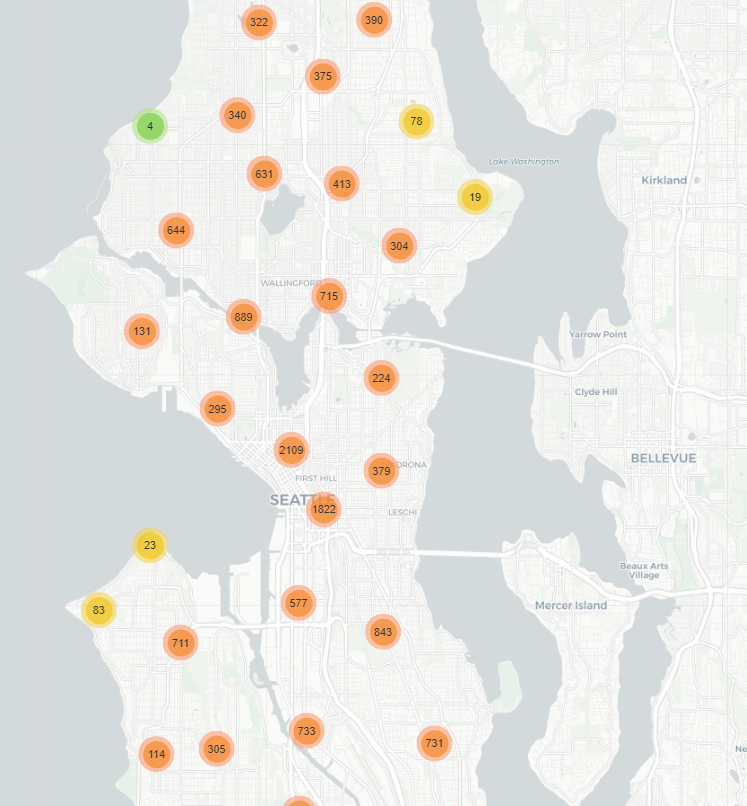
Location based analysis
Collision at Blocks and Intersections are more common than in Alley.
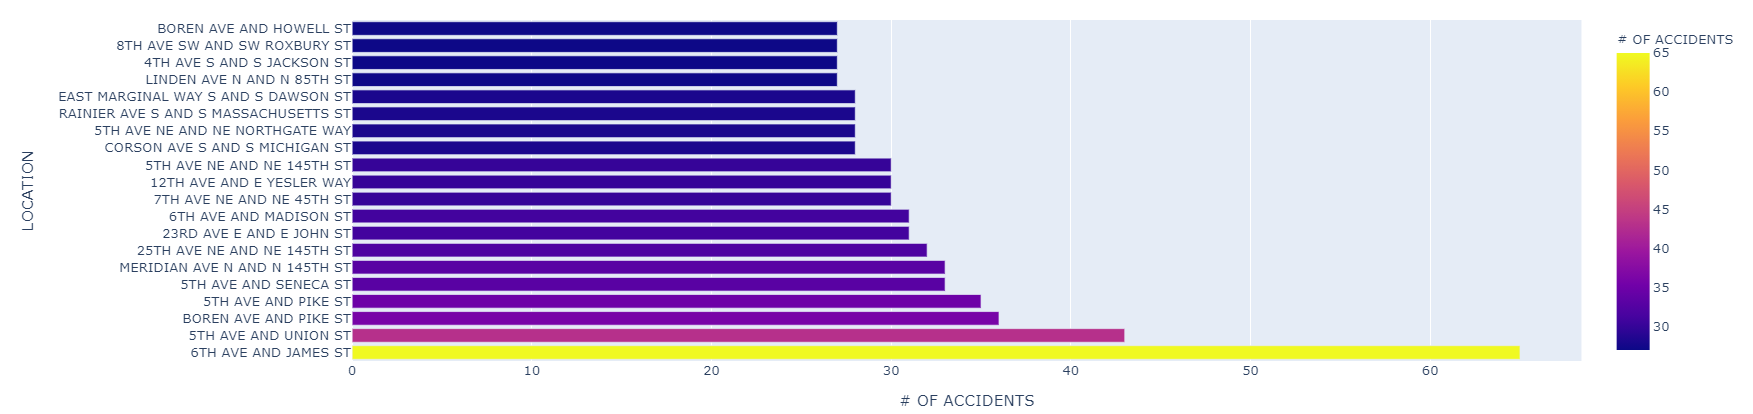
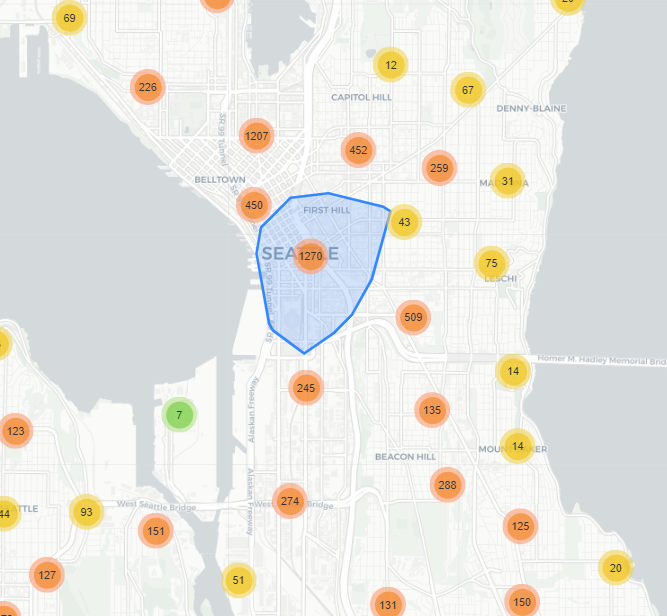
While analyzing the accidents, we came across certain accident hotspots. "6th AVE AND JAMES ST" has an abnormally high number of collisions since 2016
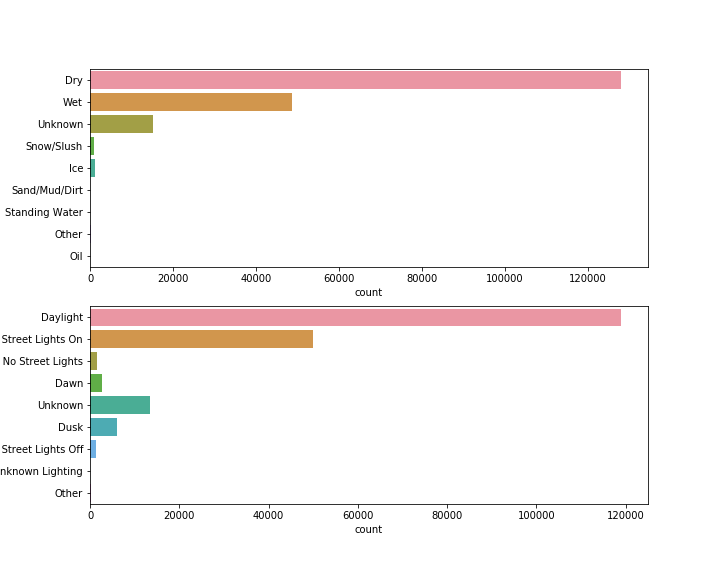
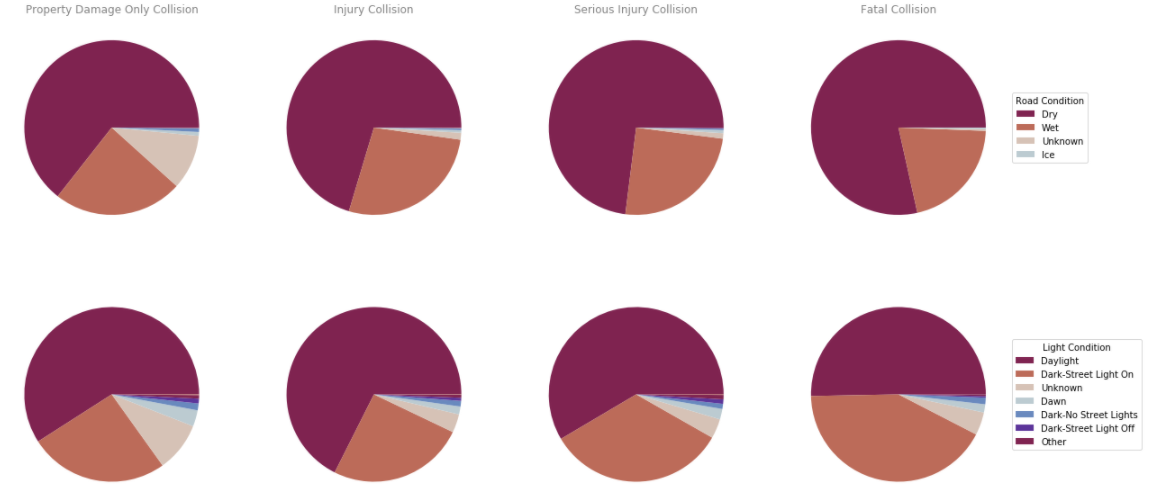
Was it you or the roads and lights?
We have data on-road and light conditions where the collision happened. We can see that majority of collisions happened at dry roads and in daylight. We checked for the severity of these conditions.
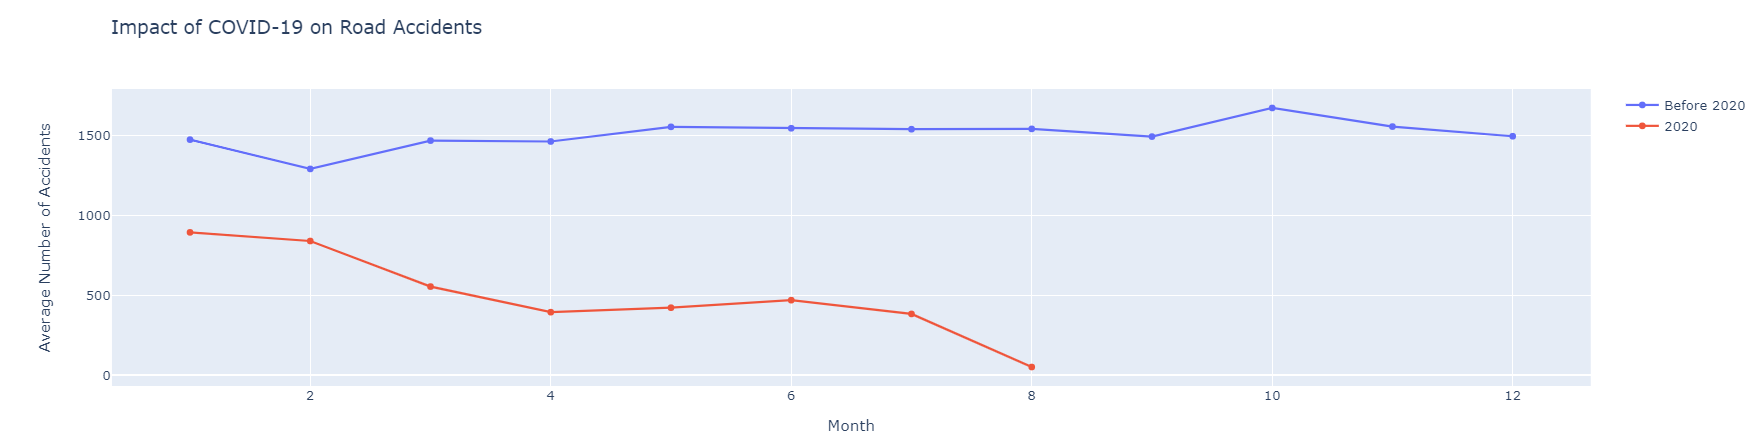
Collisions quarantined?
In 2020, the whole world faced a pandemic of the COVID-19 outbreak. Its effect on travel behavior has also been sudden and wide-ranging. We can see that there is a sudden drop in accident cases in 2020, due to the COVID-19 pandemic
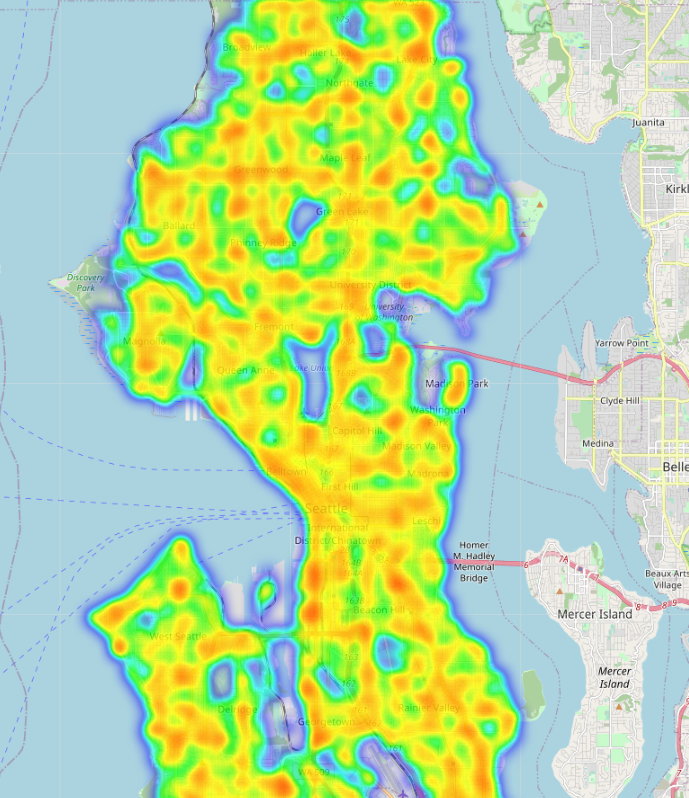
Seeing the bigger picture
Conclusion
After the thorough analysis, we have a better understanding of the causes and reasons for major road accidents. We see that although only 26% of accidents involve any injury, the number is still too high. The majority of the cases happen between the afternoon and evening, thus people driving during these hours should be more careful. The visuals convey to us that severity of the accident is higher during the day than late night, something we thought wasn't likely. We also see that speeding causes more accidents late at night. Additionally, in night-time accidents primarily happen because of less visibility. Thus, drivers should avoid speeding and be more careful during the night to avoid accidents. The data tells us that severe accidents more likely happen at blocks or intersections, as expected.
Moreover, we see that there is a spike in drunken driving cases during December (holiday season), the law enforcement should particularly take care during this time for such incidents. Here we see that utilizing analysis on top of the visuals entails one to bring out insights that may lead to a breakthrough, for example understanding that the chances of being in an accident while turning left are more than while turning right. This information forms the core of the data analysis process. An effective, well-designed, and beautiful visualization is great but you shouldn't lose the context hidden in data art and must focus upon data-driven decisions that may engage your stakeholders. It is crucial to be a good visual storyteller rather than a visual artist, bringing out stories from data is what companies seek and require.