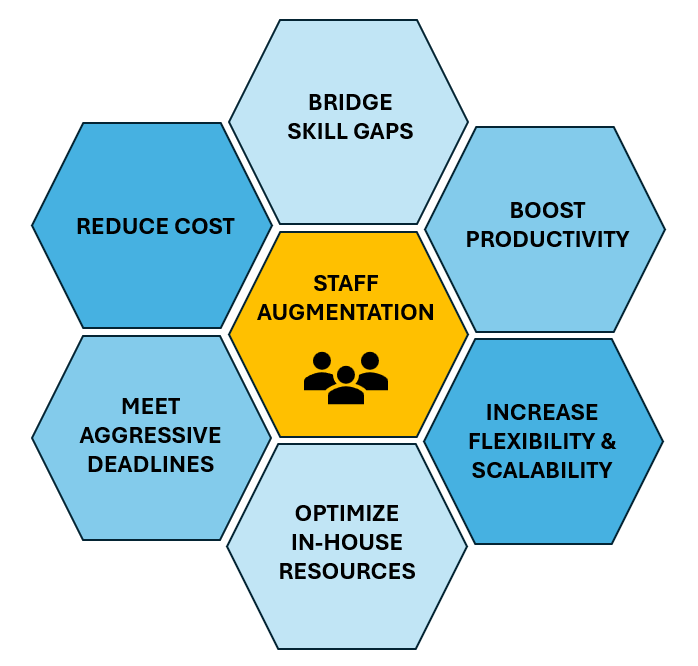
In today’s fast-paced digital world, securing the right talent at the right time is critical. Our Staff Augmentation services empower you to seamlessly integrate highly skilled data and analytics professionals into your existing teams—bridging skill gaps, accelerating timelines, and reducing the overhead of traditional hiring.
Whether you need a senior data architect to lead a complex cloud migration, a data engineer to design and optimize pipelines, or a dedicated data scientist to drive a new machine learning initiative, we provide flexible, on-demand expertise tailored to your business needs.
Unlike short-term contracting, our Staff Augmentation model is built for partnership and long-term success. Our certified professionals align with your company’s goals, culture, and processes, working as an extension of your team.
Gain Immediate Expertise:Access pre-vetted, certified experts who deliver value from day one.
Boost Productivity: Leverage specialized skills—from building scalable data pipelines to accelerating machine learning workflows—to improve efficiency and speed delivery.
Stay Flexible: Scale your team up or down based on demand—pay only for what you need.
Enable Knowledge Transfer: Our experts collaborate closely with your staff, sharing best practices and upskilling your team.
Maximize ROI: Avoid recruitment, onboarding, and training costs while ensuring faster results.
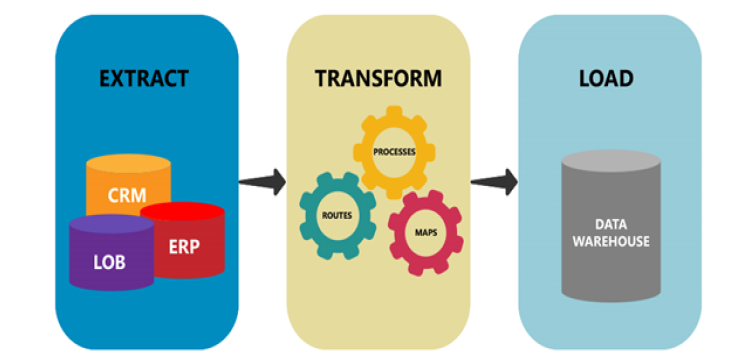
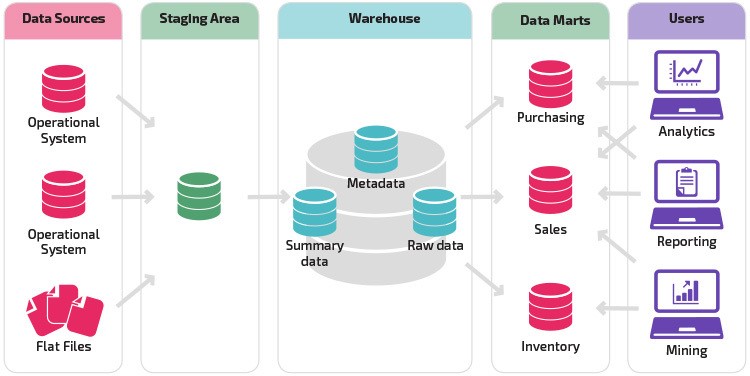
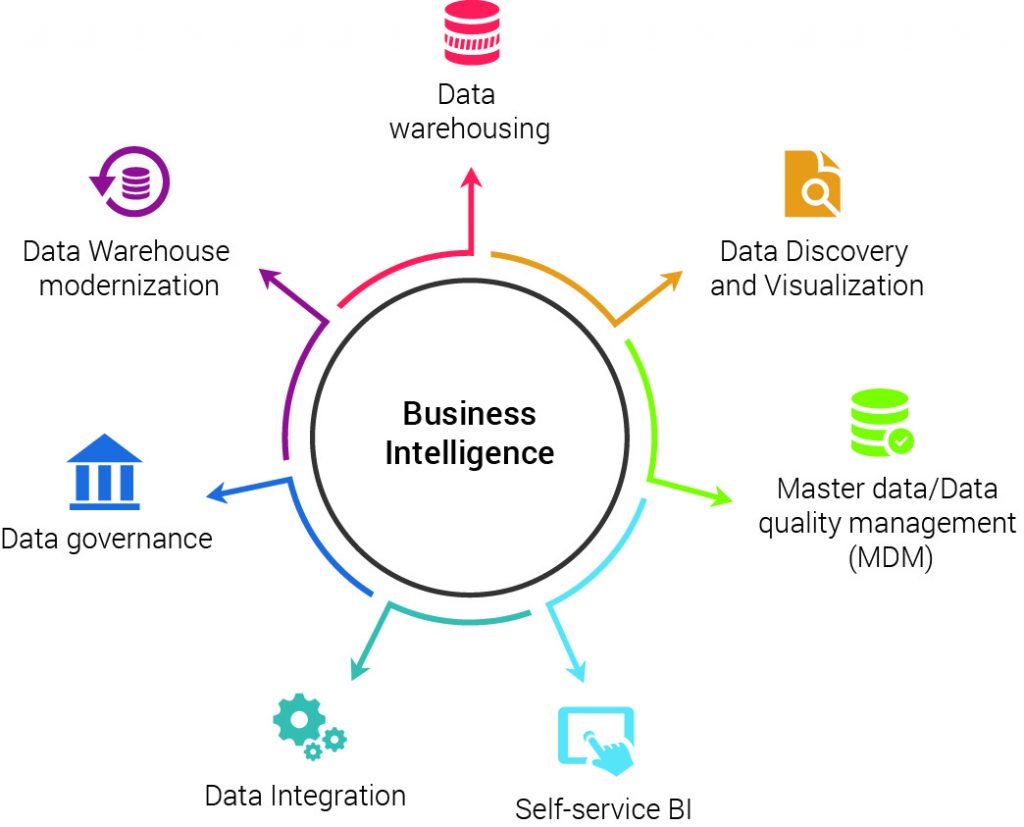
Today companies have more data than ever at their disposal but deriving meaningful insights from that data and converting knowledge into action is easier said than done. Integrating, reorganizing, and consolidating large amounts of data from a variety of different sources is a key consideration when planning data warehouse architecture.
Extract-Transform-Load (ETL) processes are used to extract, clean, transform, and load data from source systems for cohesive integration, bringing it all together to build a unified source of information for business intelligence. A key design concept, ETL is at the core of data warehouse architecture. It ensures that all the processes connect seamlessly, and data continues to flow as defined by the business, shaping, and modifying itself where and when needed according to your workflow.
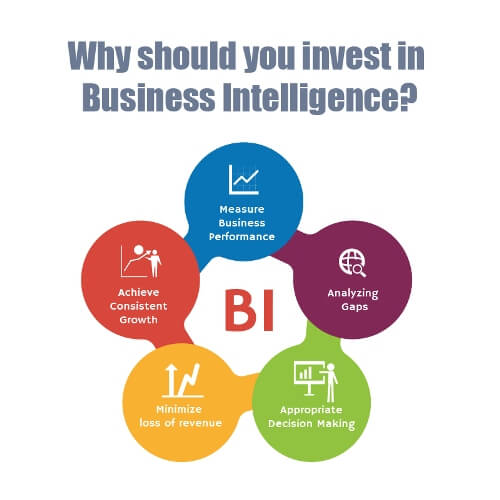
Spreadsheets no longer provide adequate solutions to accurately analyze and utilize all the business information It is pivotal to empowering organizations to collect data effectively and transform insight into action. Thus, Business Intelligence and reporting is extremely crucial. Organizations today need continuous intelligence to identify growth opportunities, streamline costs, enhance operational efficiencies and increase profitability. In the current business environment characterized by shrinking time to market, enhanced competition and a dynamic business and technology landscape, availability or non-availability of meaningful business intelligence can decide the success or failure of an enterprise. We develop smart reports with the help of modern BI reporting tools, and develop a comprehensive intelligent reporting practice. The reports provide suggestions and observations about business trends and empower decision-makers to act, develop a more strategic approach to your business decisions and gather insights that would have otherwise remain overlooked. We have a methodical approach for KPI reporting, visualization, and insights discovery. KPI reports and dashboards for tracking and alerting on pre-defined performance indicators, either before or after a data science exercise A structured, iterative approach of drilling the data on dimensions of relevance to discover patterns of interest through both visual and tabular analyses.
• Assessment of Current Business and corresponding requirements
Stakeholder expectations and Dashboard objectives
Business context and constraints
Internal and external data sources
Envisaging outputs/dashboard
• Business Intelligence Strategy & Road Map
Exploratory data analysis
KPIs used in industry, best practices
Analyses and KPIs to address business problems
• Business Intelligence Solution Modelling
Data cleansing and consistency checks
Data transformations and KPI construction
Load data into the target database
• Intelligent Report & Dashboard delivery
Tools and technology choices
Build dashboard prototype
Conduct User Acceptance Testing
Release dashboard and schedule for updates
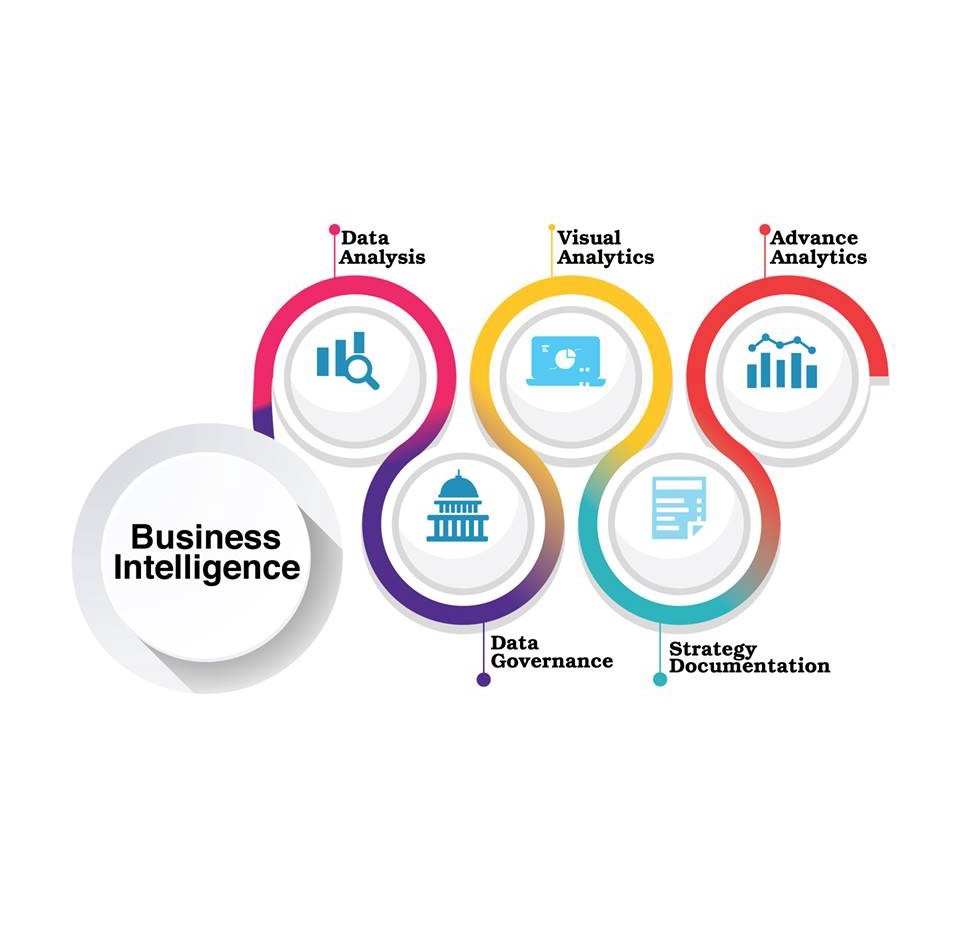
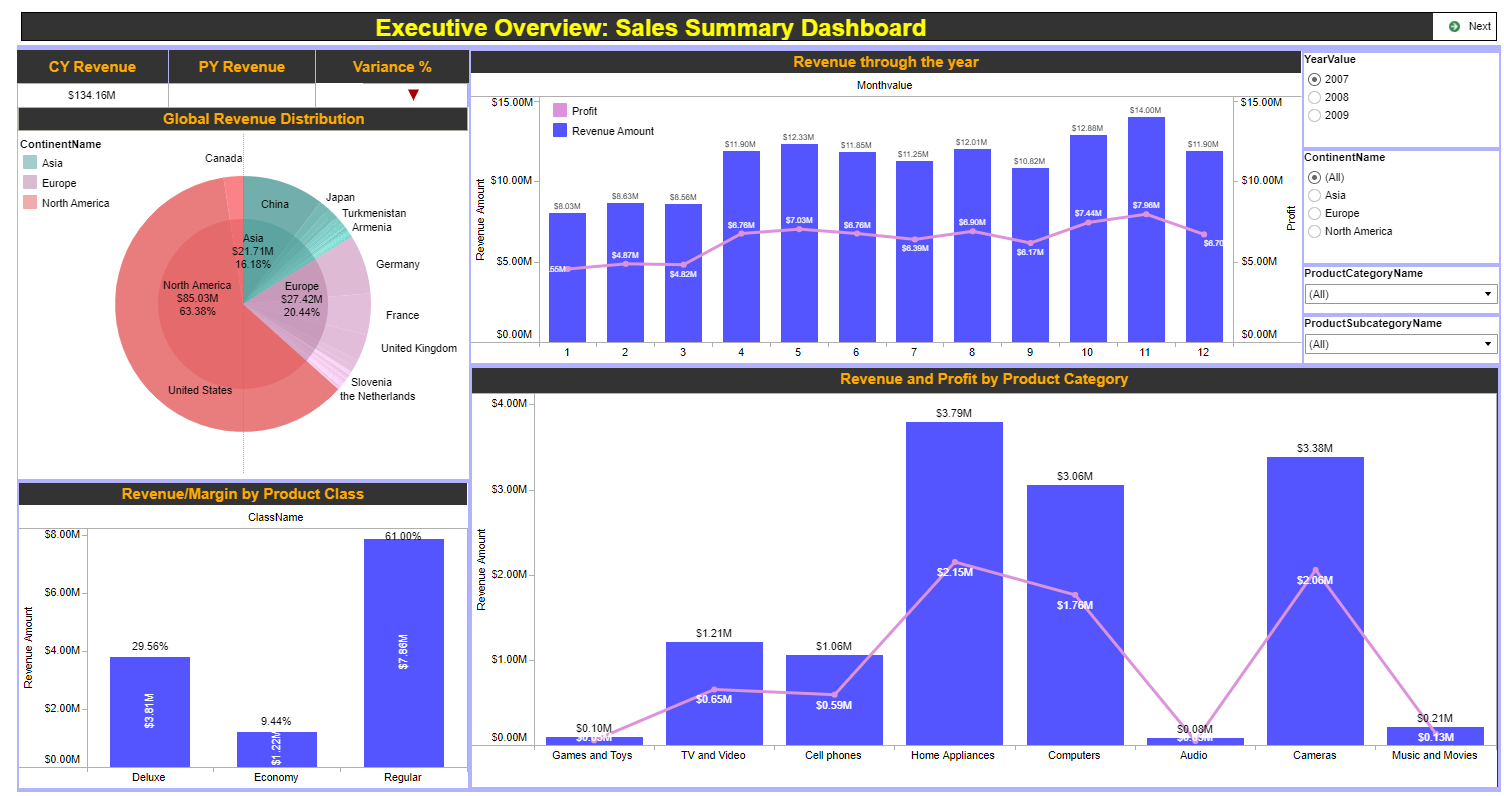
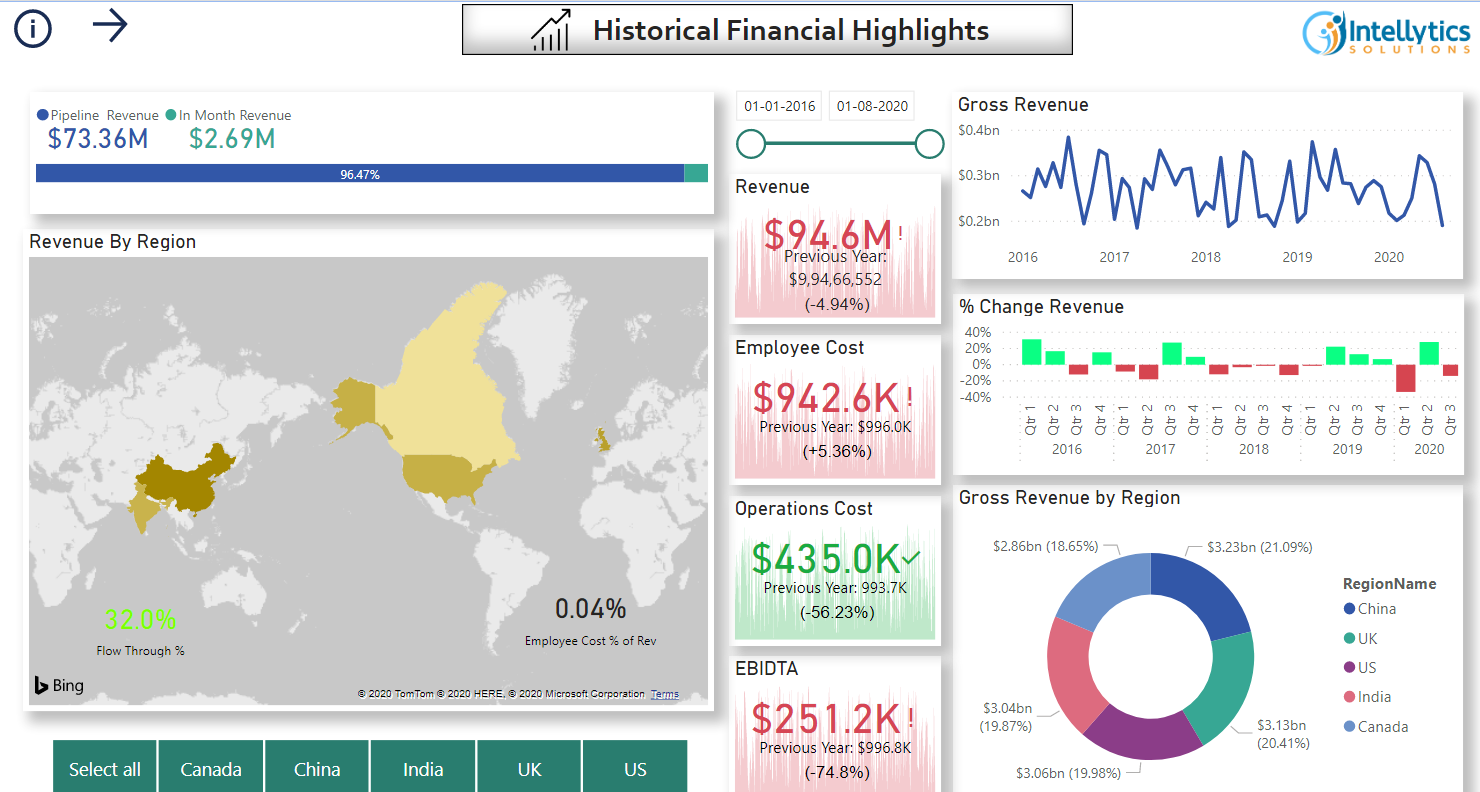
We develop smart reports with the help of modern BI reporting tools like Power BI, Tableau. The reports provide suggestions and observations about business trends and empower decision-makers to act, develop a strategy, and gather insights that would have otherwise remain overlooked. Data visualization is the communication of data in a visual manner, or turning raw data into insights that can be easily interpreted by the viewers. Data visualization is the process of translating large and complex datasets and summarizing them in a visual format. This not only makes the data easier to understand but also pleasant to look at, which helps you get people's attention more effectively. Advantages of data visualization
• Provide greater insight
• Improve your decision-making process
• Engage the audience
• Easily repurposed
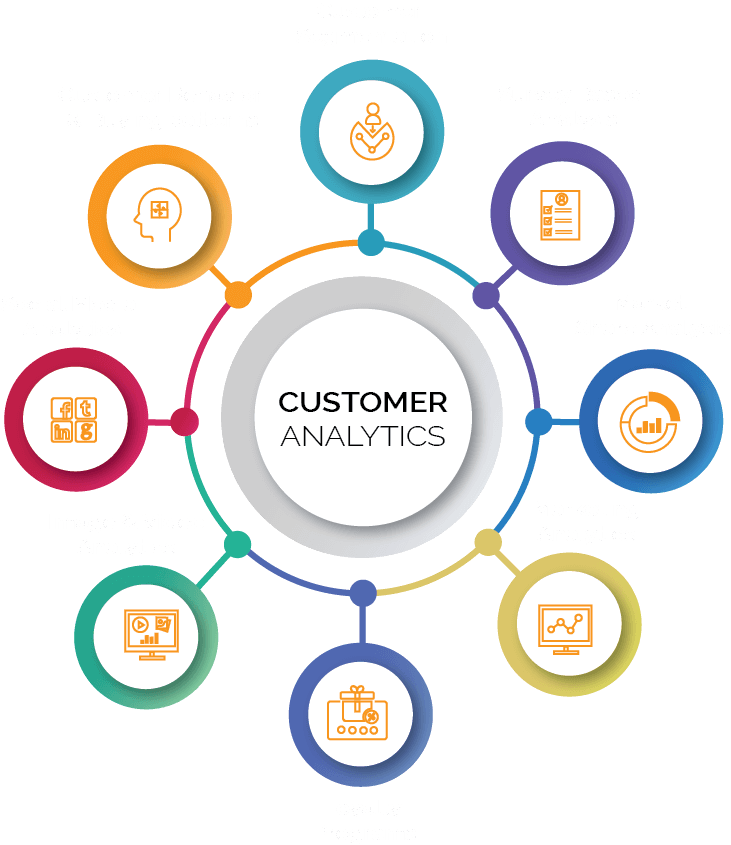
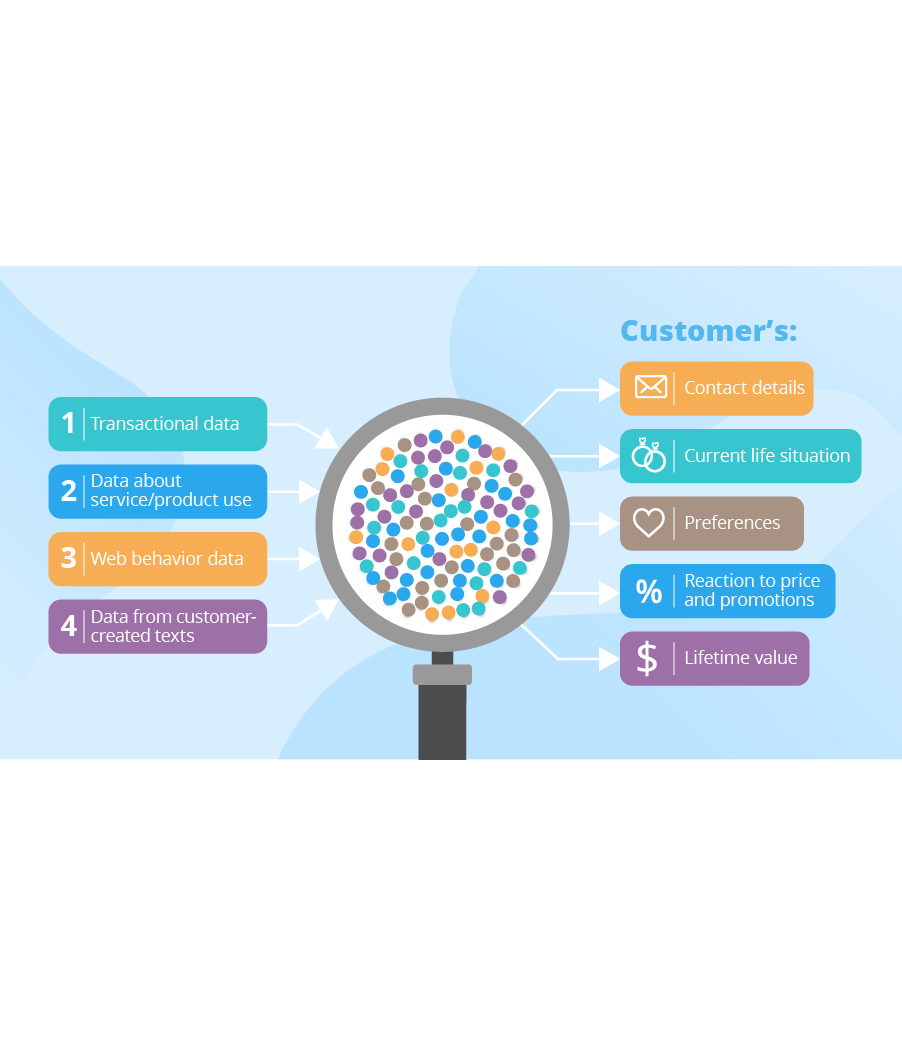
A deeper understanding of the customer has never been as important as it is today. Social media, open information, new business models, and ever increasing options make it paramount to understand the pulse of customers and predict their behaviors. We assist in understanding your customers better to drive stronger sales & customer relationships by utilizing data , technology , predictive modelling and market segmentation. We utilize structured and unstructured data combining it with in-store and online behaviors along with social hearing and surveys to give organizations a 360-degree customer view. We help build a comprehensive strategy that accounts for multiple data sources including commerce, customer relationship management (CRM), enterprise marketing management, and marketing automation systems. We give you the tools, processes, and strategy to achieve responsiveness and accuracy in customer analytics, allowing you to better meet your customers’ expectations, reduce costs, and improve operations.
• Clustering and segmentation, profiling
• Predictive models for repeat, response, churn
• Adoption and customer journey
• Cross and Up sells
• Better Forecast Buying Habits and Target High-Profit Customers
• Attrition & Loyalty Management
• Reporting & Analysis
• Customer Lifetime Value
• Customer 360 View
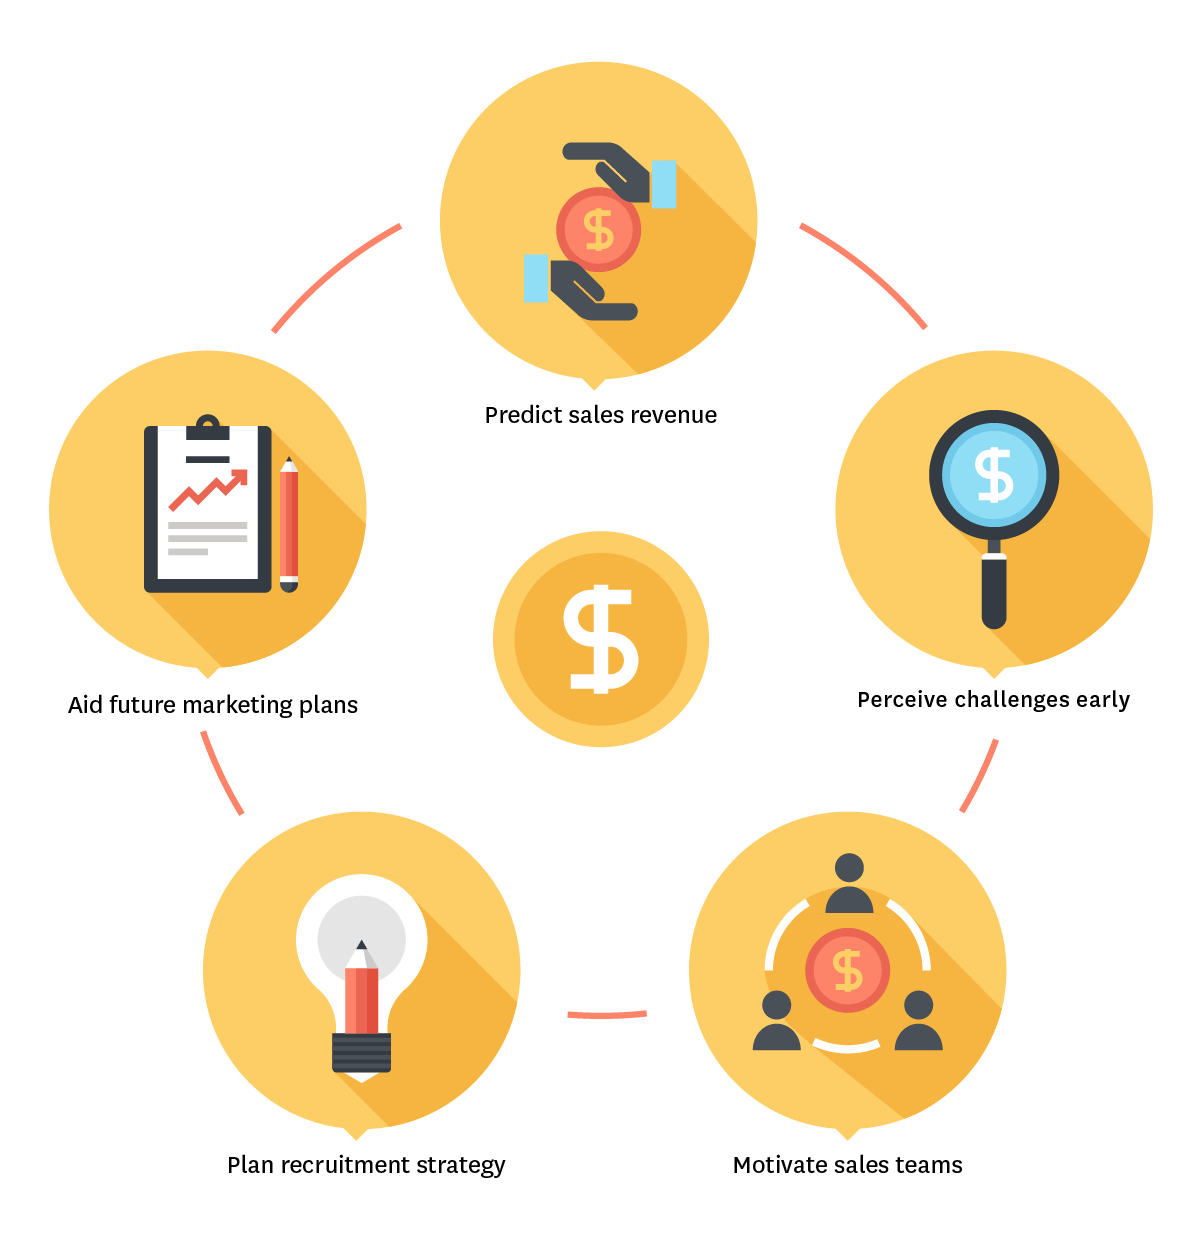
Revenue forecasting helps you budget business expenses early and provide with a very educated guess for your upcoming financial needs. This information will be crucial to make the best possible choices for your business.
Go beyond statistical forecasting experience smart forecast modeling utilizing machine learning techniques like time series, moving averages, regression algorithms along with various types of forecasting like historical, opportunity stage, pipeline forecasting etc. we improve the forecasting accuracy for better revenue analysis. Better understanding of Business with Revenue Analysis by identifying
• Holidays impact on business
• Revenue changes over the months and seasons
• The trend changing over the years
• Similarity analysis across locations and identifying objective way to compare them
• Improving production scheduling
• Sales and product analysis
The importance of revenue forecasting is not just limited to budget allocation and planning for the next year, it also highly impacts strategic planning and decision-making processes that lead to the future success and growth
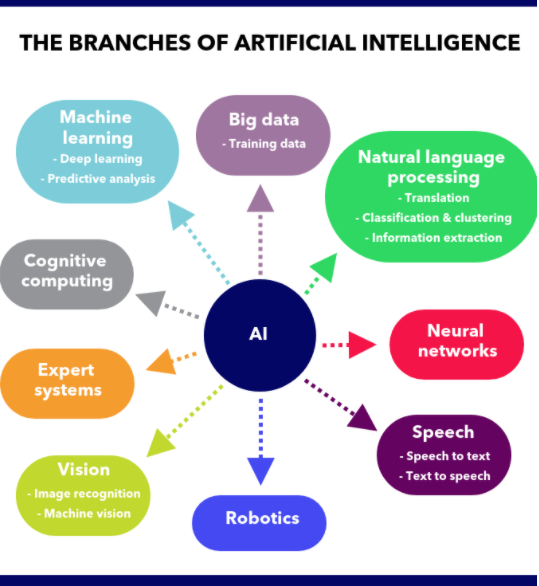
Artificial Intelligence can digitally transform businesses by leveraging technology to enhance human capabilities. AI will enable businesses to work smarter and faster, doing more with significantly less. We provide cutting edge AI solutions through the integration of the analytics and automation, solutions including but not limited to Process Automation, Recommender Systems, Natural Language Processing, Computer Vision and Business Analytics through AI.
Why you should choose us for AI?
• We have inhouse experts with years of experience in Machine Learning and Deep Learning Frameworks like Tensorflow and Pytorch
• Experience in providing Automation Solutions, Computer Vision, NLP and Recommender Systems
• We provide end-to-end integratable solutions
• Intellytics is a Microsoft Partnered Company, hence we also provide Azure Machine Learning Solutions